- two panels, 35° south
- 780–900 kWh/yr
- two panels, vertical south
- 570–650 kWh/yr
- max inverter output
- 800 W
- max panel power
- 2,000 W
For your own postcode, direction and tilt, use the calculator.
How much does a kit make in your city?
From PVGIS 5.3 (the EU’s solar model, 2005–2023 averages, 14% system losses). The first two columns are per kWp of panels; the last two are for our 0.88 kWp reference kit.
| City | Per kWp, 35° south | Per kWp, vertical south | 0.88 kWp, 35° | 0.88 kWp, vertical |
|---|---|---|---|---|
| London | 1,019 kWh | 743 kWh | 897 kWh | 654 kWh |
| Bristol | 1,023 kWh | 739 kWh | 900 kWh | 650 kWh |
| Edinburgh | 903 kWh | 682 kWh | 794 kWh | 601 kWh |
| Manchester | 886 kWh | 646 kWh | 780 kWh | 569 kWh |
Two things stand out:
- Latitude matters less than you’d think. Edinburgh out-generates Manchester in this data.
- Vertical panels make 72–76% of a 35° tilt over a year, but more in December. In Bristol, vertical gives 39.9 kWh per kWp in December against 33.8 kWh at 35°. In June it’s about half (62.9 against 122.9). Flatter output across the year helps you use more of it yourself.
DESNZ’s modelling uses a different method (SAP) and lands a little lower: 690 kWh a year for an 800 W kit at 30° south, and 378 kWh vertical facing east or west (impact assessment, Table 7).
What does the 800 W limit mean?
The legal limit is on the inverter, not the panels. A plug-in microgenerator must have “a maximum rated alternating current output not exceeding 800 watts” (SI 2026/848). The product specification allows up to 2,000 W of panels (IPS §4.1).
So a kit can have more panel than inverter. On bright days the panels could deliver more than 800 W, and the inverter caps it. That lost output is called clipping.
Is extra panel worth it?
Our working from a PVGIS hourly series for Bristol, south at 35°, for 2020, scaled to each array size and capped at 800 W:
| Panels (kWp) | Before the cap | Clipped | Share lost | After the cap |
|---|---|---|---|---|
| 0.88 | 943 kWh | 0 | 0% | 943 kWh |
| 1.2 | 1,286 kWh | 35 kWh | 2.7% | 1,251 kWh |
| 1.6 | 1,714 kWh | 205 kWh | 12.0% | 1,509 kWh |
| 2.0 | 2,143 kWh | 452 kWh | 21.1% | 1,692 kWh |
Going from 0.88 to 2.0 kWp (more than double the panel) adds around 80% more output, not 127%. Extra panels mostly help in the mornings, evenings and winter, when output is below the cap.
What these figures can't show
2020 was sunnier than average at this spot: the 2005–2023 mean for 0.88 kWp is about 900 kWh. Hourly averages also smooth out short peaks, so real clipping will be somewhat higher than shown. Treat the “clipped” column as a minimum.
For kits with more than 960 W of panels, manufacturers must advise you to “consider professional assessment” of your home’s wiring (IPS §4.1). See sockets and wiring.
How does that compare with what you use?
- Ofgem’s typical medium household uses 2,500 kWh of electricity a year (Ofgem).
- DESNZ’s impact assessment uses a GB average of 3,323 kWh.
- DESNZ says a kit can provide “up to 20% of an average home’s electricity use” (press release).
The catch is timing. Output you don’t use as it’s generated flows out to the grid, usually unpaid. With medium daytime use, we estimate about half of a 0.88 kWp kit’s output is used at home: roughly 390–450 kWh a year across the four cities. That’s the number that saves you money. See is it worth it and self-consumption.
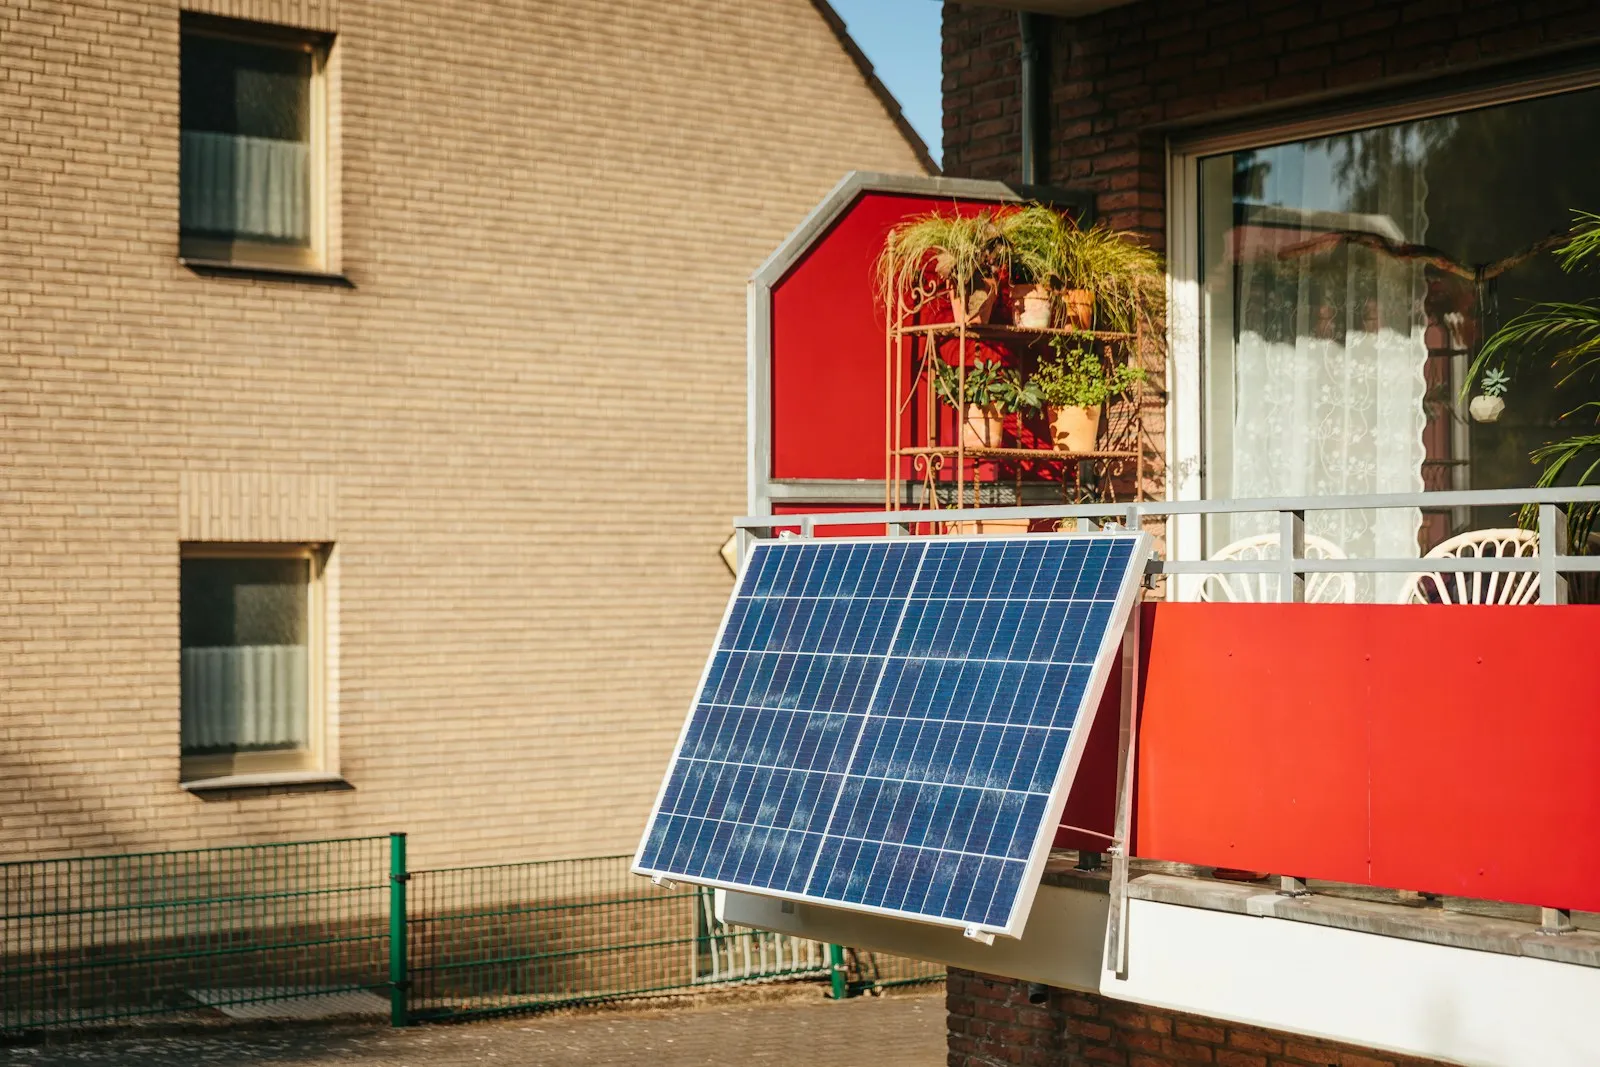
A panel angled out from a balcony. Tilt and direction change yearly output more than which city you live in.
What else changes the output?
- Direction. South is best; east and west lose some; north loses most. See east-west and north-facing.
- Tilt. A 35° tilt beats vertical over a year by roughly a third, but vertical wins in midwinter.
- Shade. PVGIS allows for hills on the horizon, not trees, buildings or the balcony above.
- Panel age. We assume 0.5% less output each year.
What to do next
- Get a figure for your own spot in the calculator.
- Deciding between one panel and two? Read 400 W vs 800 W.
- See which Compliant kits are in stock now.
Sources
- EU JRC PVGIS 5.3 (non-interactive service)
- SI 2026/848 (800 W AC definition)
- DESNZ Plug-in Solar Device Interim Product Specification v2.0 (July 2026)
- DESNZ plug-in solar final-stage impact assessment
- DESNZ press release (27 Aug 2026)
- Ofgem: Summary of changes to the energy price cap, 1 October to 31 December 2026